Min-Max Normalization
I was working with some LLMs, and I need to compare a set of LLMs based on metrics like Latency, GPU Power Usage, Alignment, Similarity, Clarity, and Conciseness for 9 Open Source LLMs. So I thought Spider/Radar Chart would be the best to show the comparison in a single graph. On plotting my data directly I got
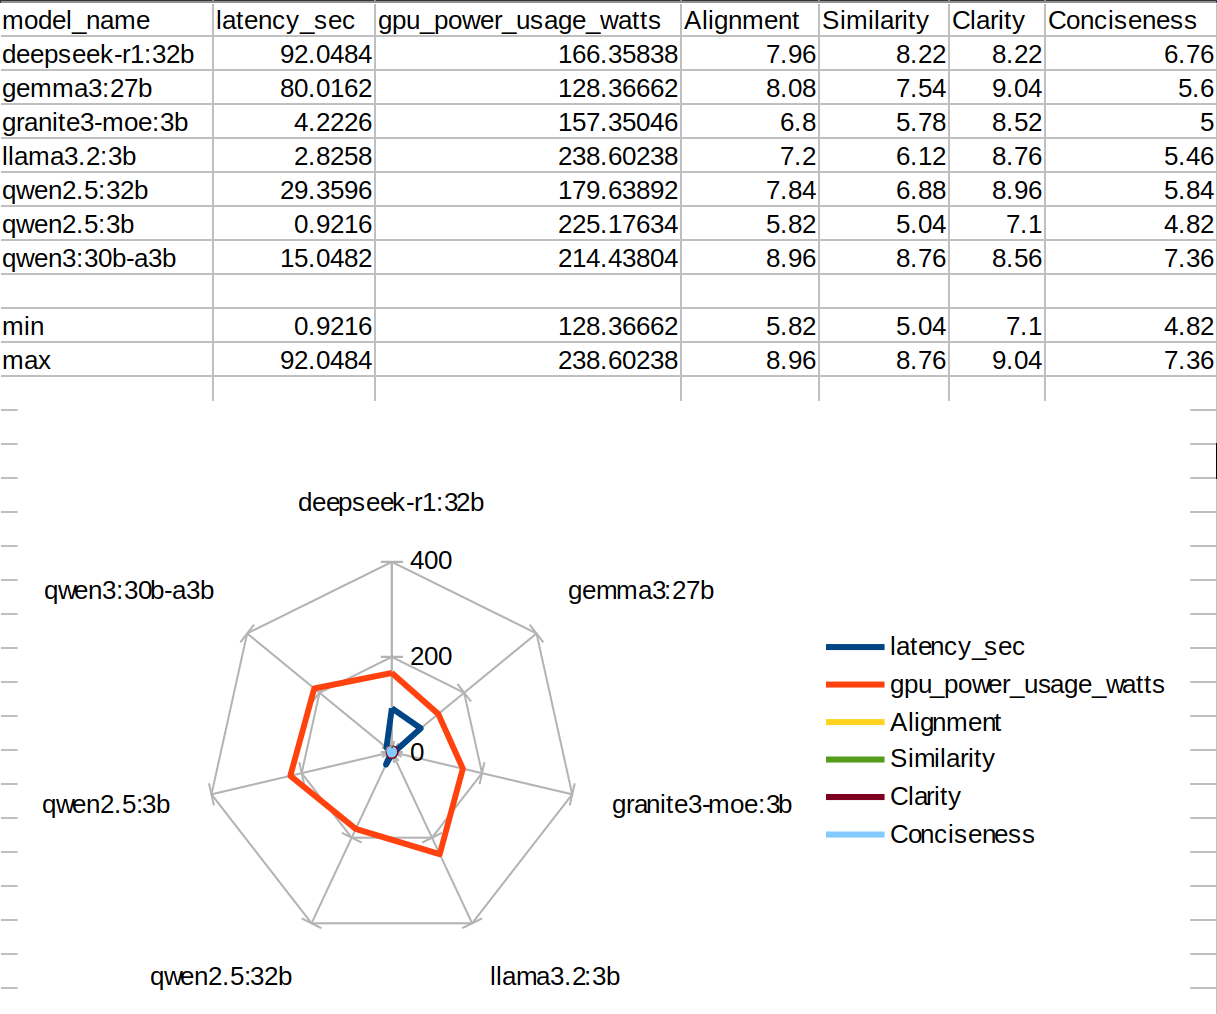 Before Normalizing
See, the scaling of my data was wrong, as Alignment to Conciseness was scaled between 0-10 and the other two has no standard scaling. So I need to bring the Latency and GPU Power Usage values between 0 to 10. So the solution was Min-Max Normalization.
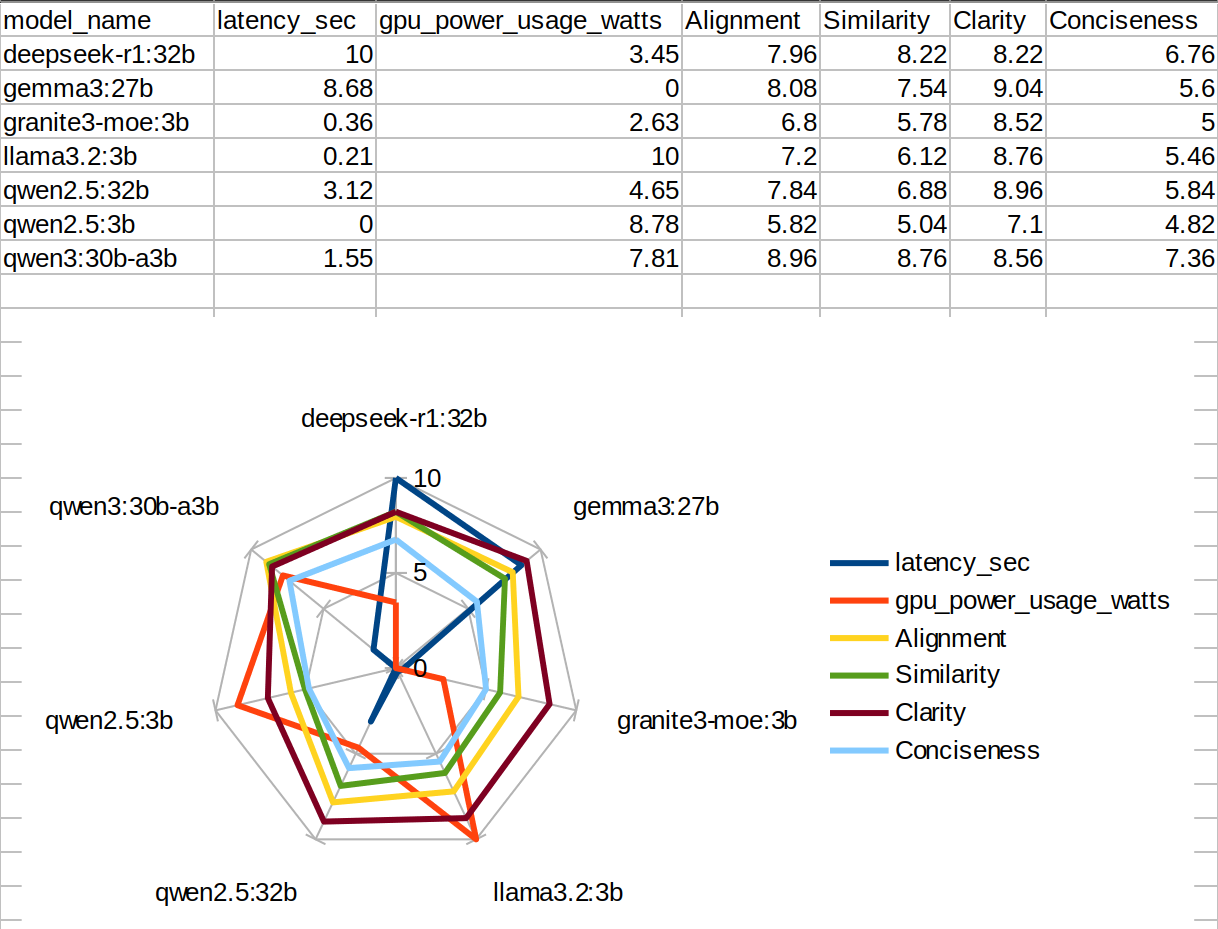 After Normalizing
Note: Though it seems to be working(clearly plotting all values), just take a look at gemma3:27b's gpu_power_usage_watts and qwen2.5:3b's latency_sec - they're 0. This doesn't mean they didn't used gpu or fast answering, but a common error in min-max normalization. There are many solutions - Add a small constant (Additive to Smoothing) denominator and numerator, Log-Scale Transformation [, the apply min-max norm to ]
Now an Example:
We have values [23, 37, 11, 76] and the requirement is to scale it between 0-10, i.e,
Now we can put all the x(s) and get the min-max normalized values
| Real Values | New Values |
|---|---|
| 23 | 1.8 |
| 37 | 4 |
| 11 | 0 |
| 76 | 10 |
Python Code Snippet for Min-Max Normalization:
normalized = ((values - old_min) / (old_max - old_min)) * (new_max - new_min) + new_min
Normalization vs Standardization vs Scaling
| Concept | Definition | Formula | Range | Use Case |
|---|---|---|---|---|
| Normalization | Rescales values to a fixed range (usually [0, 1] or [0, 10]) | Any range | Visualizations, ML when scale matters (e.g., KNN) | |
| Standardization | Centers data around mean 0 and standard deviation 1 | Mean = 0, SD = 1 | When data is Gaussian, or algorithms assume zero-centered data | |
| Scaling | Generic term – includes both normalization and standardization | N/A | N/A | Any transformation to bring values into a defined scale |