Converting Bank Statements to Insights: Automating Future Data Collection using Gmail Zapier and Google Sheets Part 1

Read on Medium
We all spend 12–15+ years studying, aiming to secure a job or start a business — in other words, to make money. Most of us succeed in one way or another. As Malayalam actor Prithviraj Sukumaran once said in an interview, “Getting to a position is easier, but maintaining it is harder”. The same applies to money—earning, whether from a job, investments, real estate, rentals, or even through family support may come relatively easily, but managing it wisely is much more challenging. That’s where financial trackers become essential. They allow us to visually track where our money comes from and where it goes, enabling us to make informed decisions. This blog will guide you in building a simple yet automated personal finance tracker.
For your information: After finishing the blog, I realized it has a reading time of about 35 to 40 minutes, which is too long for any reader. So, I decided to split the story into two parts.
Part 1 (this story): Converting Bank Statements to Insights: Using Google Sheets for Data Transformation and Cleanup.
Part 2: Converting Bank Statements to Insights: Automating Continuous Data Collection and Building a Self-Updating Dashboard with Gmail, Zapier, and Google Sheets.
Part 1
-
Backstory
-
Data Collection
-
Data Transformation
-
Converting HTML File to CSV Format — The Failed Attempt.
-
What Led to the Failure of Old Transaction Data Collection?
-
-
Arranging and Cleaning Axis Bank Transaction Data
1. The Backstory
I started seriously thinking about managing and tracking my finances in late September 2024. By the end of September, I explored how others handle personal finance tracking by checking out sample templates on Google Sheets and Microsoft Excel and watching YouTube videos. Then, I started the data collection by the start of October 2024, however, due to the heavy work involved in logging the transactions, either by writing it down and then typing it into a spreadsheet or typing the data directly into the spreadsheet, I didn’t do the data collection task correctly. This time I realized why seasoned data professionals say ‘collecting data is the most tiring process’. So I found an easier way to do this process using ‘Google Forms to populate the Google Sheet’ — I made a Google form with questions Date, Details, and Credit/Debit and kept the link to this form in an easily accessible place, but this also has a downside, as this is similar to typing directly into google sheets but instead of opening the sheet app I open the forms app. Therefore that step also failed, in short — I failed fast and searched for other options. After a few days, I noticed a pattern: I was using Google Pay for most of my transactions. Each time I used Google Pay or withdrew money from an ATM, a notification was sent to me as a message to my phone and mail to my Gmail. While I initially saw these emails as redundant, I soon realized they could be useful for automating my data entry. I thought, why not extract transaction data from these emails and enter it directly into my Google Sheet? To automate this, I needed a service that could access my Gmail, identify whether a mail is about a bank transaction, then identify whether it is about credit or debit, and finally format and upload the data to my Google Sheet. As the mediator, I chose Zapier a reliable tool with bank-level encryption, so I could trust it while working with sensitive data. With Zapier, Gmail, and Google Sheets, my personal finance tracking system started to take shape, as shown in the diagram below.
![]() My Automated Personal Finance Tracking System
My Automated Personal Finance Tracking System
2. Data Collection
I used two bank accounts — Canara Bank and Axis Bank. My current account is with Axis Bank, while my Canara Bank account was deactivated two years ago. To start, I needed to gather data from both banks. I accessed Axis Bank’s Internet Banking services.
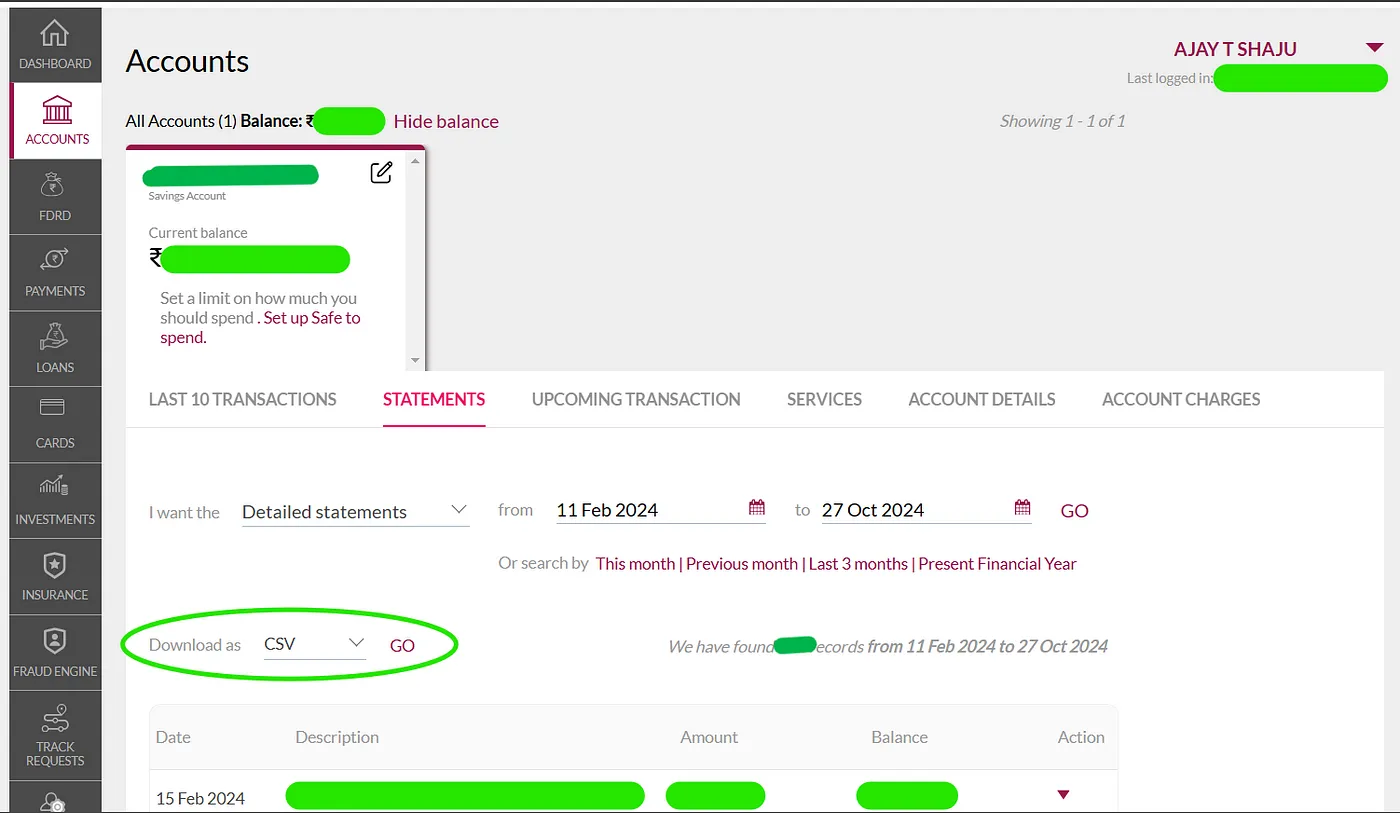 Axis Bank Internet Banking Interface
Navigated to Account Statements, and downloaded my statements as CSV files. Since Axis Bank only allows transaction exports for up to 366 days at a time, I had to download two files. The first covered February 2023 to February 2024, and the second included February-March 2024 to October 2024. Below, you’ll see images of these two CSV files.

Two CSV files containing my Axis Bank transactions
However, I ran into an issue when trying to retrieve data from Canara Bank. After deactivating my Canara Bank account, I deleted all related emails, account statements, and notifications from Gmail, severing my connection with the bank. This data would have been valuable, especially for machine learning or deep learning projects where more data enhances model accuracy. With records dating back to 2021, I could have added around 1,500 rows of data. In an attempt to recover this information, I searched Google Pay for any 2021 transaction data related to Canara Bank and found some. I used Google Takeout to get my Google Pay data but discovered that the CSV file where the data can be found is empty, I tried requesting the data multiple times while writing this blog and sent Google feedback about this problem, but still no data is seen in the money send and requests CSV file from Google Takeout.
 Empty money send and requests CSV file from Google Takeout
However, I found an HTML file showing a simple web page with my transactions, including the amount, date, time, and some basic details.
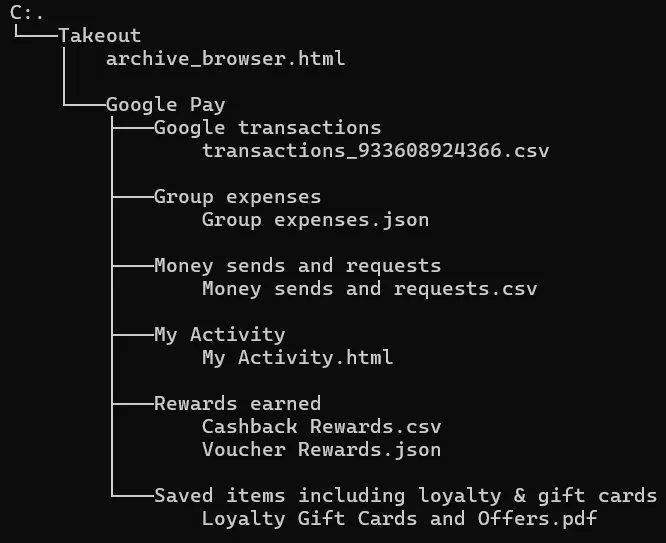 Folder tree of Google Pay data takeout
Unfortunately, this HTML file posed another challenge since it wasn’t straightforward to convert this into CSV format. In the next section, I will explain the series of tasks I followed to extract the data.
3. Data Transformation
Converting HTML File to CSV Format — The Failed Attempt.
I started by opening the MyActivity.html file in VS Code, only to see an overwhelming amount of unreadable characters. To make sense of it I selected all the text, right-clicked, and pressed the Format Document option (Keyboard shortcut: Shift + Alt + F). VS Code then automatically structured the text, making it much cleaner and easier to read.
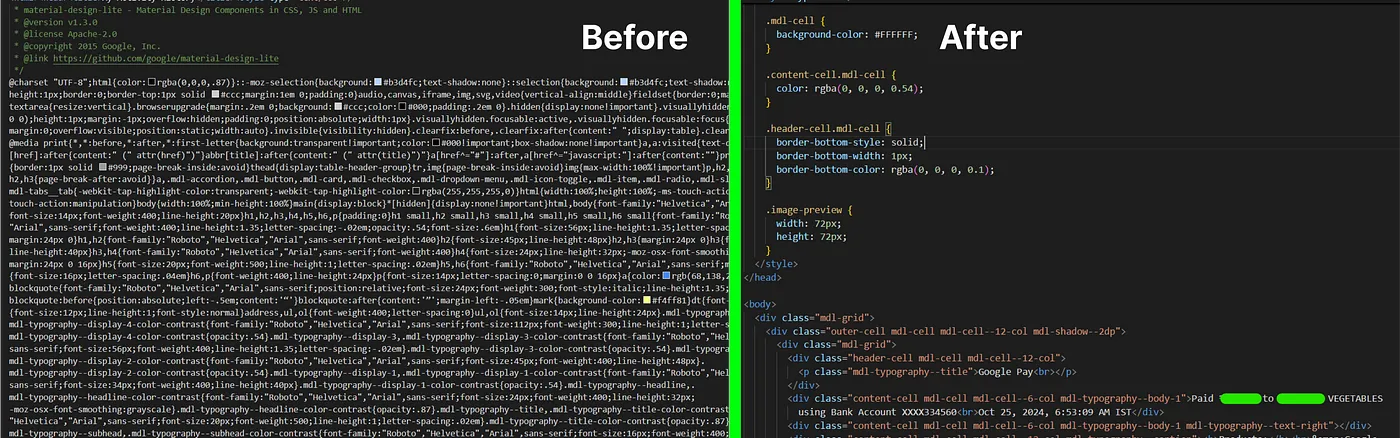 Before and After view of formatting the code on VS Code
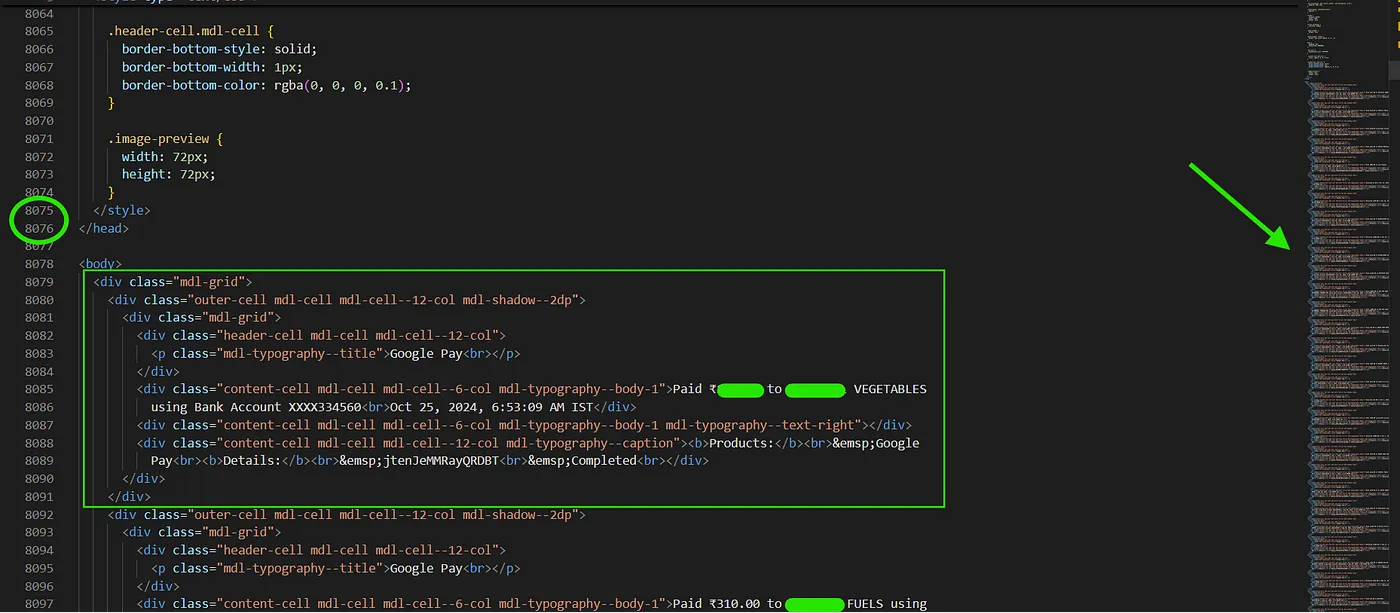 Line number and Div container structure
I examined the readable file and discovered around 8,000 lines of code were CSS styling before the actual HTML content began. The HTML portion, containing about 40,000 lines, presented each transaction in horizontally aligned div containers where each was defined by repetitive code blocks specifying layout and styling(see the rendered image below). Then I checked for patterns in the div container HTML code. I noticed that it included transactions marked as “completed”, “pending”, “failed,” and “Personalization within Google Pay”. I marked these in my note — remove the repetitive lines and all incomplete transactions.
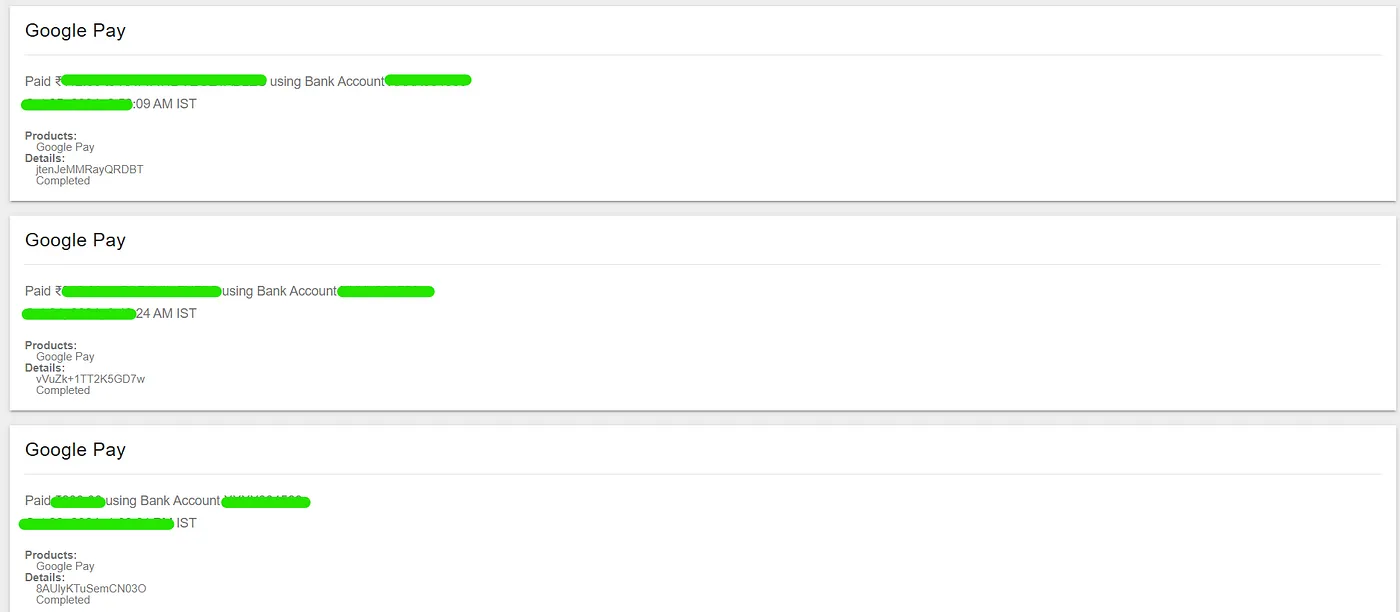 Rendered HTML Code
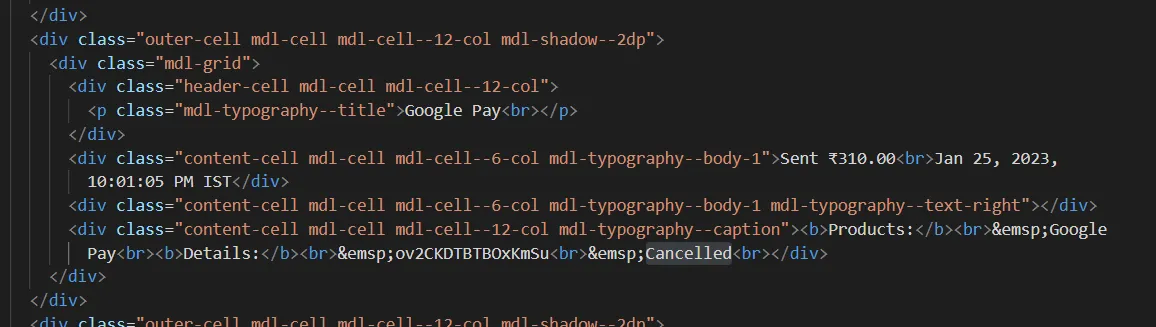 Items marked as cancelled in the HTML file
In VS Code I used a code snippet from ChatGPT, which utilized Python’s BeautifulSoup library to retain only the “completed” transactions, removing the rest. This process reduced about 20,000 lines of code, and then I used the Find and Replace tool to eliminate repeated lines, which reduced 12,000 lines from the file.
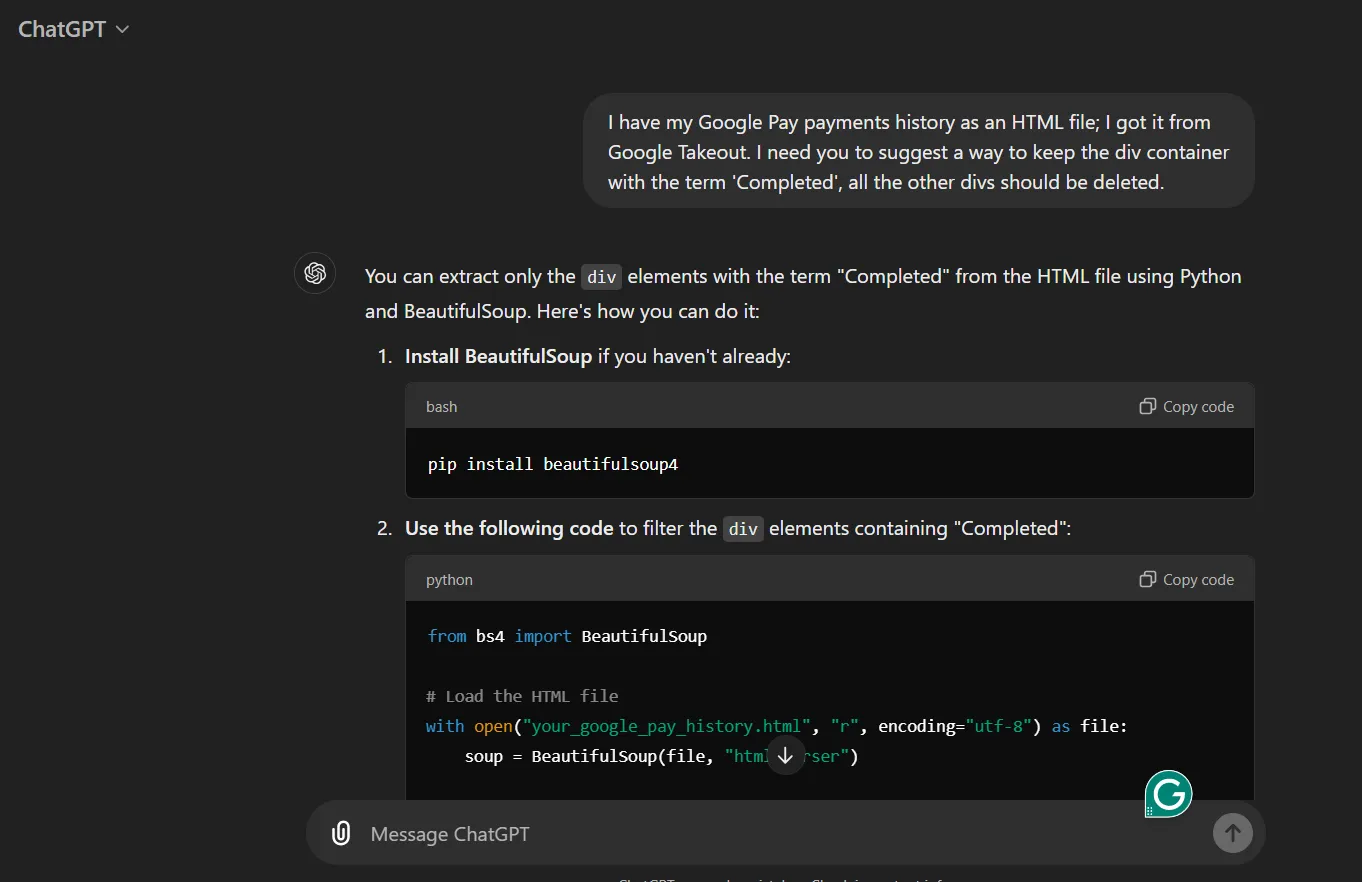 ChatGPT helping cleanup my HTML code
However, the HTML still has unique identifiers and other unnecessary elements, so I applied regular expressions to remove these. Let’s see the details of regex patterns and other techniques I used for this cleanup.
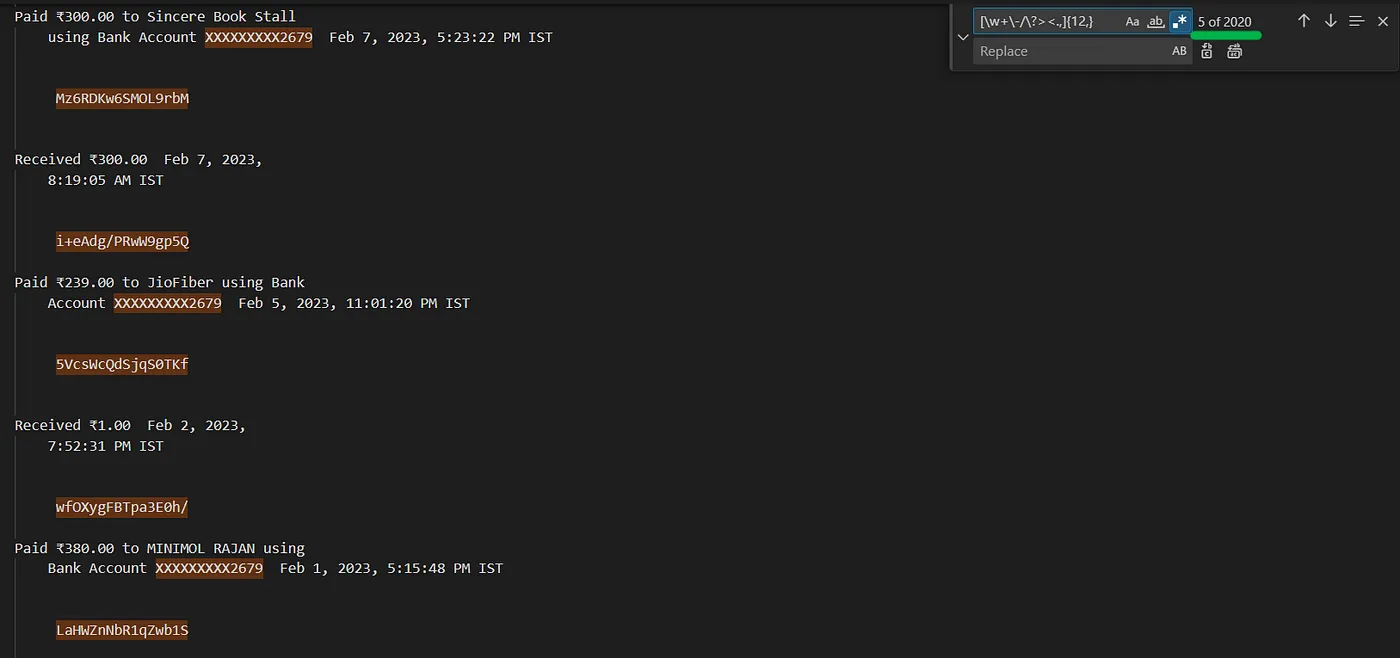 Finding alphanumeric unique identifiers using RegEx in VS Code
-
\d{1,2}:\d{2}:\d{2}\s*[AP]M— For matching the time of format “1:55:45 PM” -
[\w+\-/\?><.,]{12,}— For matching unique identifier code of transactions, eg — ‘d1i/lfg8SWqU31//’, ‘pWg1Hw7hTYCvKDgE’, ‘Mz6RDKtr6SmOL3rbM’ -
Find
' '(5 spaces) and Replace it with a single space, and repeat until this until 5 spaces become 2 spaces. -
\n\n\n\n\n— For matching line breaks(multiple enter/return presses). -
Ctrl + Shift + L— For selecting all similar items that match the current selection.
After these regexes and other techniques, I need to do a little bit of manual work for about 15 minutes, to remove some items where there are no patterns to search for. While working with regular expressions it takes many trial and error steps, so I recommend using the regex101 website for quick testing of patterns.
Finally, I was left with clean text-based transaction messages, such as “Paid Rs.100.00 for Play Store Recharge on 28–09–2020”, but in order to convert it to a CSV format having columns Date, Details, Credit, Debit, and Balance, this text-based is not suitable. Typing or copying this data manually would be extremely time-consuming and repetitive, so I decided to leverage Llama 3, installed on my system through Ollama, for the task. Llama, like ChatGPT’s GPT Engines, is a large-language model that I can use on my local machine, allowing me to keep my transaction data private. I accessed Llama via Windows PowerShell, spending some time crafting precise prompts to guide it in formatting the data. See our chat below.
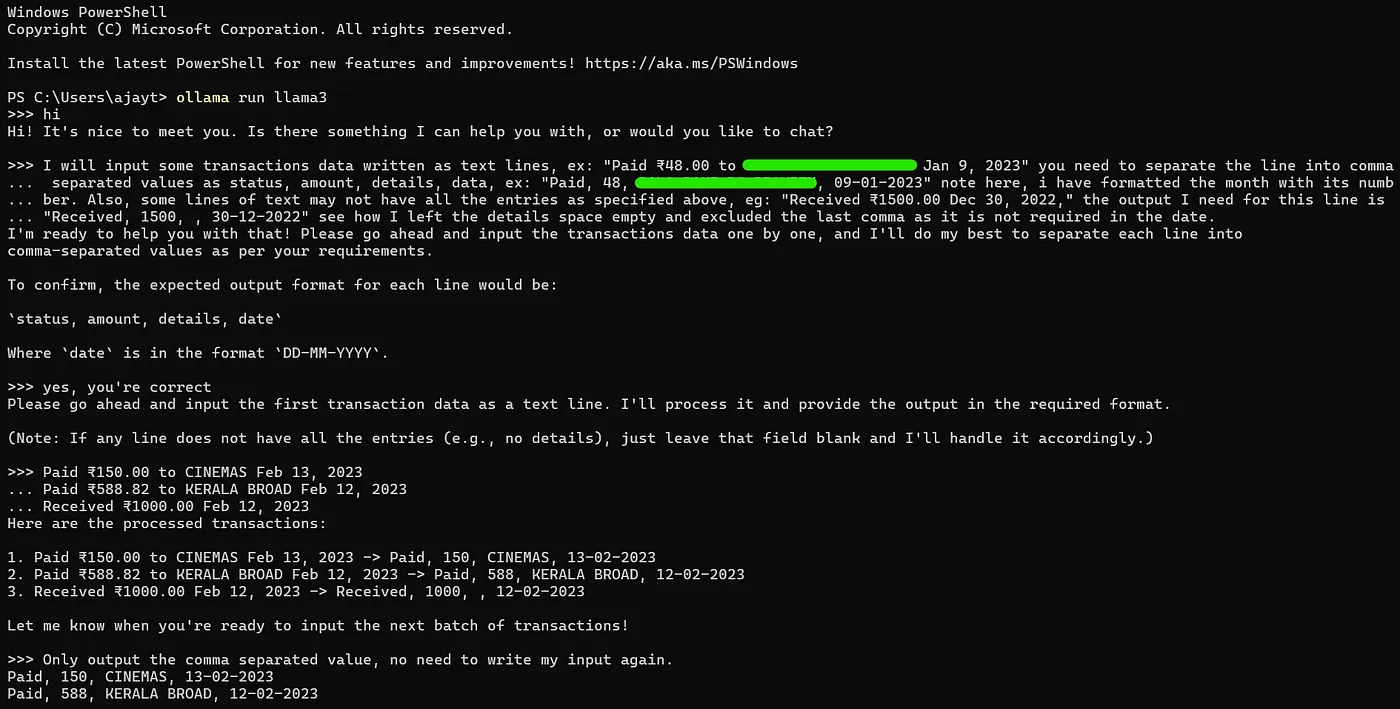 Prompting Llama3 to output transactions in a specific format
Llama processed my requests efficiently, outputting each line in the desired format. With this structured output, I could save it as a text file, and then import it into Excel as a CSV by specifying the comma as a delimiter. Once in Excel, I applied formulas to automate the categorization of Credit and Debit transactions using the IF formula. For example, if cell A1 contained “paid,” I directed the amount to the Debit column; otherwise, it went to the Credit column. I then used the formula Previous Balance - Debit + Credit to calculate balances, while a simple TEXT formula extracted the month and year from each date (e.g., TEXT(A1, “MMMM”) for the month and “YYYY” for the year).
This approach significantly sped up the process, enabling me to format all my data within minutes.
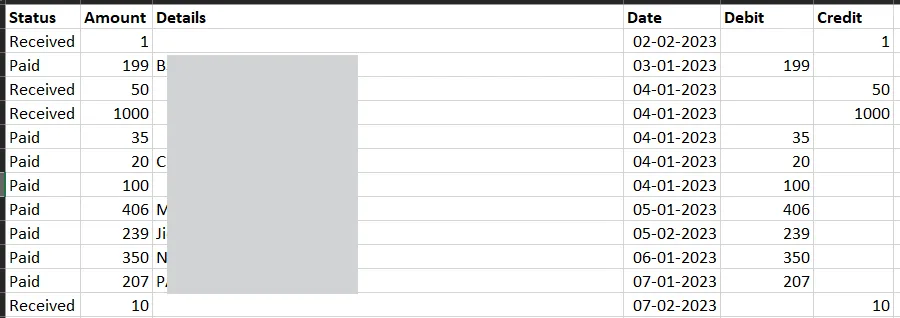 Old Transactions data from Canara Bank in Excel with different formulas applied
What Led to the Failure of Old Transaction Data Collection?
I simply won’t categorize the transaction data collection as a complete failure; rather, I set it aside after converting it to CSV format. There’s still considerable work required to prepare the data for purposes such as Dashboard building, Machine Learning, and Deep Learning. Preparing the data to the required form consumes a significant amount of time, especially when I need to focus on other important tasks, such as organizing the Axis Bank data, setting up the dashboard, and automating the data collection using Gmail, Zapier, and Google Sheets.
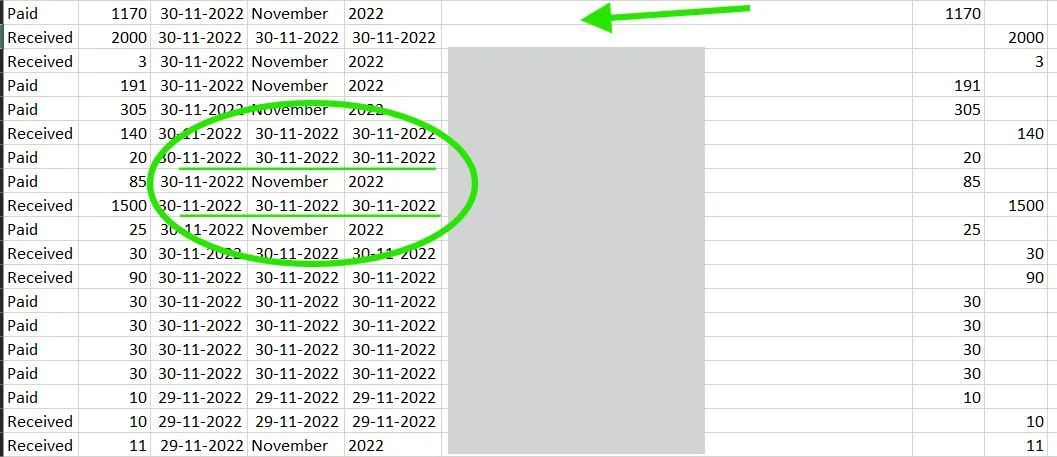 Two main problems — Date has leading spaces and lack of particulars in deatials column
Since I converted the old bank data into CSV format and saved it, I decided to hold the works temporarily. Even though this step remains incomplete, it has been immensely valuable. It taught me the unusual power of regular expressions, illustrated how even simple ideas can lead to significant outcomes(use of \n\n\n as RegEx), and strengthened the importance of testing our thoughts for better results.
4. Arranging and Cleaning Axis Bank Transaction Data
I began by locating the two CSV files containing my Axis Bank transactions, combining and loading those files as a single dataset, and transforming the data by removing unwanted columns that come while combining the CSV files (source information and table details, for example). Once I had a clean dataset, I explored it, noting that it contained five headers: Date, Details, Credit, Debit, and Balance, with a total of 942 transactions.
To enhance the dataset I added two new columns to separate the data into months and years. I achieved this using the TEXT function, as explained in the HTML to CSV conversion section. Next, I turned my attention to the details column, utilizing regular expressions to remove unnecessary parts using the pandas library of Python, you can read a similar work here.
Transforming the Transaction Data
After documenting the findings, I turned back to transform the bank data to add a new column labeled “Category” next to the details, complete with a dropdown list for easy selection.
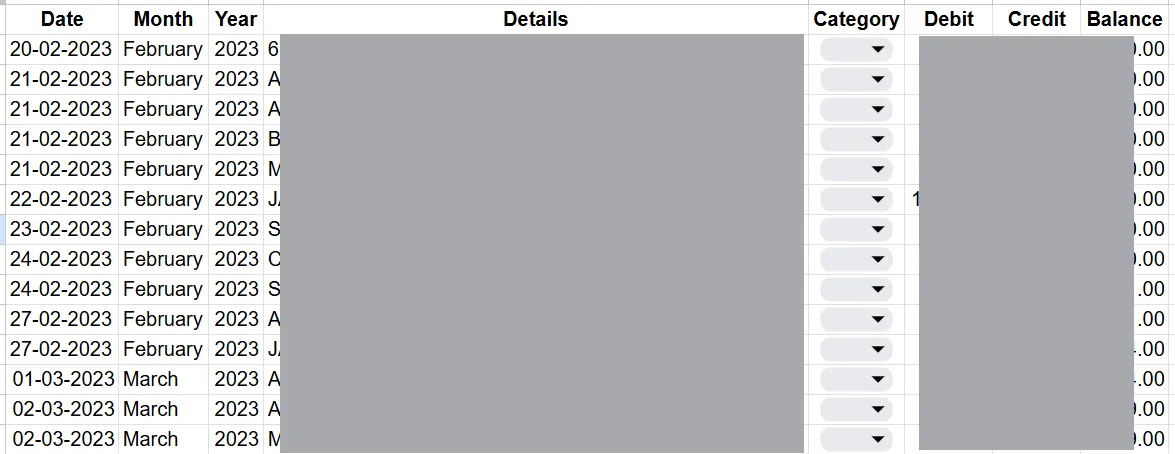 Snapshot of transformed data
However, a significant challenge arose when it came to categorizing the transactions based on the details column. With 942 rows to process, the task of selecting a category from a list of over 70+ options became repetitive and time-consuming. I started searching for different methods to streamline the category selection process, which I will explain in the next section.
Now I am concluding Part 1 here. If you are interested in knowing how I tackled certain challenges, fly to Part 2 of this story(read some sneak-peek of Part 2— Filling 940+ dropdowns in just 4–5h, integrating multiple apps to automate future data collection, and setting the dashboard).